What is Spectral Power Distribution (SPD)
Spectral power distribution (SPD), in the context of the lighting industry, is the measurement and representation of the power or intensity of light at each wavelength in the visible spectrum. It provides crucial information about the color properties and overall spectral composition of a light source.
The SPD curve, which is a graph illustrating the distribution of power across different wavelengths of light, is used to analyze and understand the characteristics of a light source. By examining the SPD curve, one can assess the color rendering capabilities, color temperature, and overall quality of the light emitted by a lamp or lighting system.
Mungkin Anda Tertarik Dengan
- Ceiling-mounted PIR occupancy sensor dengan output dry-contact relay
- Suplai tegangan rendah 12/24VDC atau 12/24VAC
- Kontak relai terisolasi COM, NO, dan NC untuk input EMS, HVAC, dan kontrol gedung
- Low-voltage DC recessed ceiling-mounted microwave motion sensor switch
- Input 12 VDC / 24 VDC dengan rentang 10-30 VDC
- Arus kerja maks 10A dengan waktu tunda (time delay), ambang batas Lux, dan sensitivitas yang dapat disesuaikan
- Higher-load recessed ceiling-mounted microwave motion sensor switch
- Input tegangan jala-jala 100-265 VAC, model 10A
- Penginderaan gelombang mikro 5.8 GHz dengan waktu tunda (time delay), ambang batas Lux, dan sensitivitas yang dapat disesuaikan
- Recessed ceiling-mounted microwave motion sensor switch
- Input tegangan jala-jala 100-265 VAC, model 5A
- Penginderaan gelombang mikro 5.8 GHz dengan waktu tunda (time delay), ambang batas Lux, dan sensitivitas yang dapat disesuaikan
- Ceiling-mounted RZ037 PIR occupancy sensor dimmer untuk daya 220V
- Arus kerja maksimum 3A dengan beban pengenal 660W
- Tombol LUX mengontrol ON/OFF sensor cahaya dan kecerahan peredupan yang diatur pengguna
- Ceiling-mounted RZ037 PIR occupancy sensor dimmer untuk daya 110V
- Arus kerja maksimum 3A dengan beban pengenal 330W
- Tombol LUX mengontrol ON/OFF sensor cahaya dan kecerahan peredupan yang diatur pengguna
- Sakelar sensor gerak gelombang mikro plafon DC tegangan rendah
- Input 12 VDC / 24 VDC dengan rentang 10-30 VDC
- Arus kerja maks 10A dengan waktu tunda (time delay), ambang batas Lux, dan sensitivitas yang dapat disesuaikan
- Sakelar sensor gerak gelombang mikro plafon beban lebih tinggi
- Input tegangan jala-jala 100-265 VAC, model 10A
- Penginderaan gelombang mikro 5.8 GHz dengan waktu tunda (time delay), ambang batas Lux, dan sensitivitas yang dapat disesuaikan
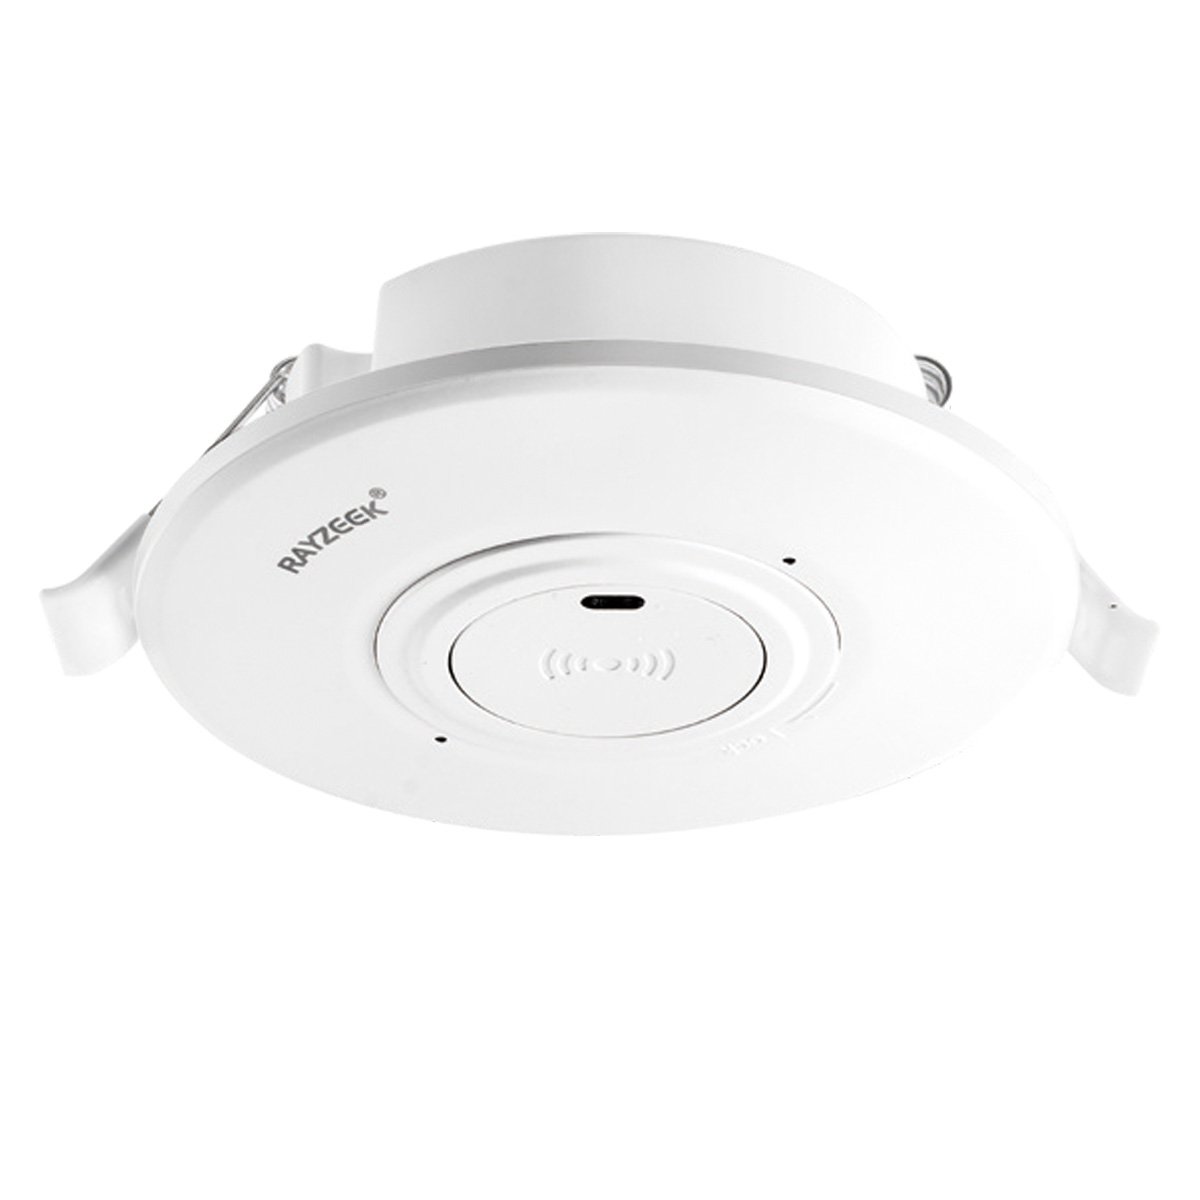
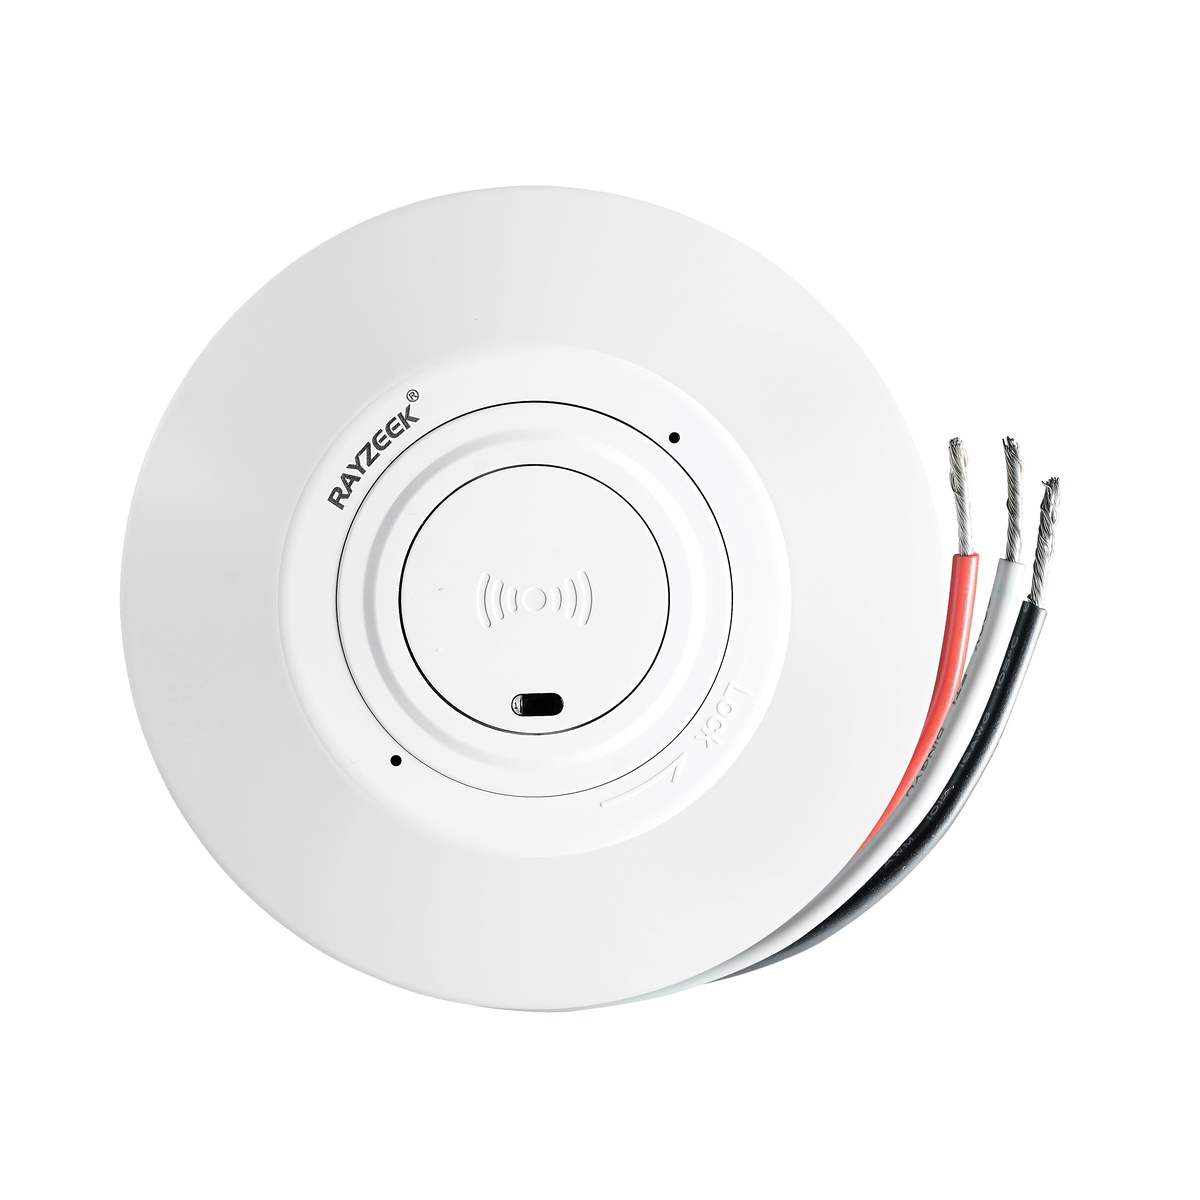
- Sakelar sensor gerak gelombang mikro plafon
- Input tegangan jala-jala 100-265 VAC, model 5A
- Penginderaan gelombang mikro 5.8 GHz dengan waktu tunda (time delay), ambang batas Lux, dan sensitivitas yang dapat disesuaikan
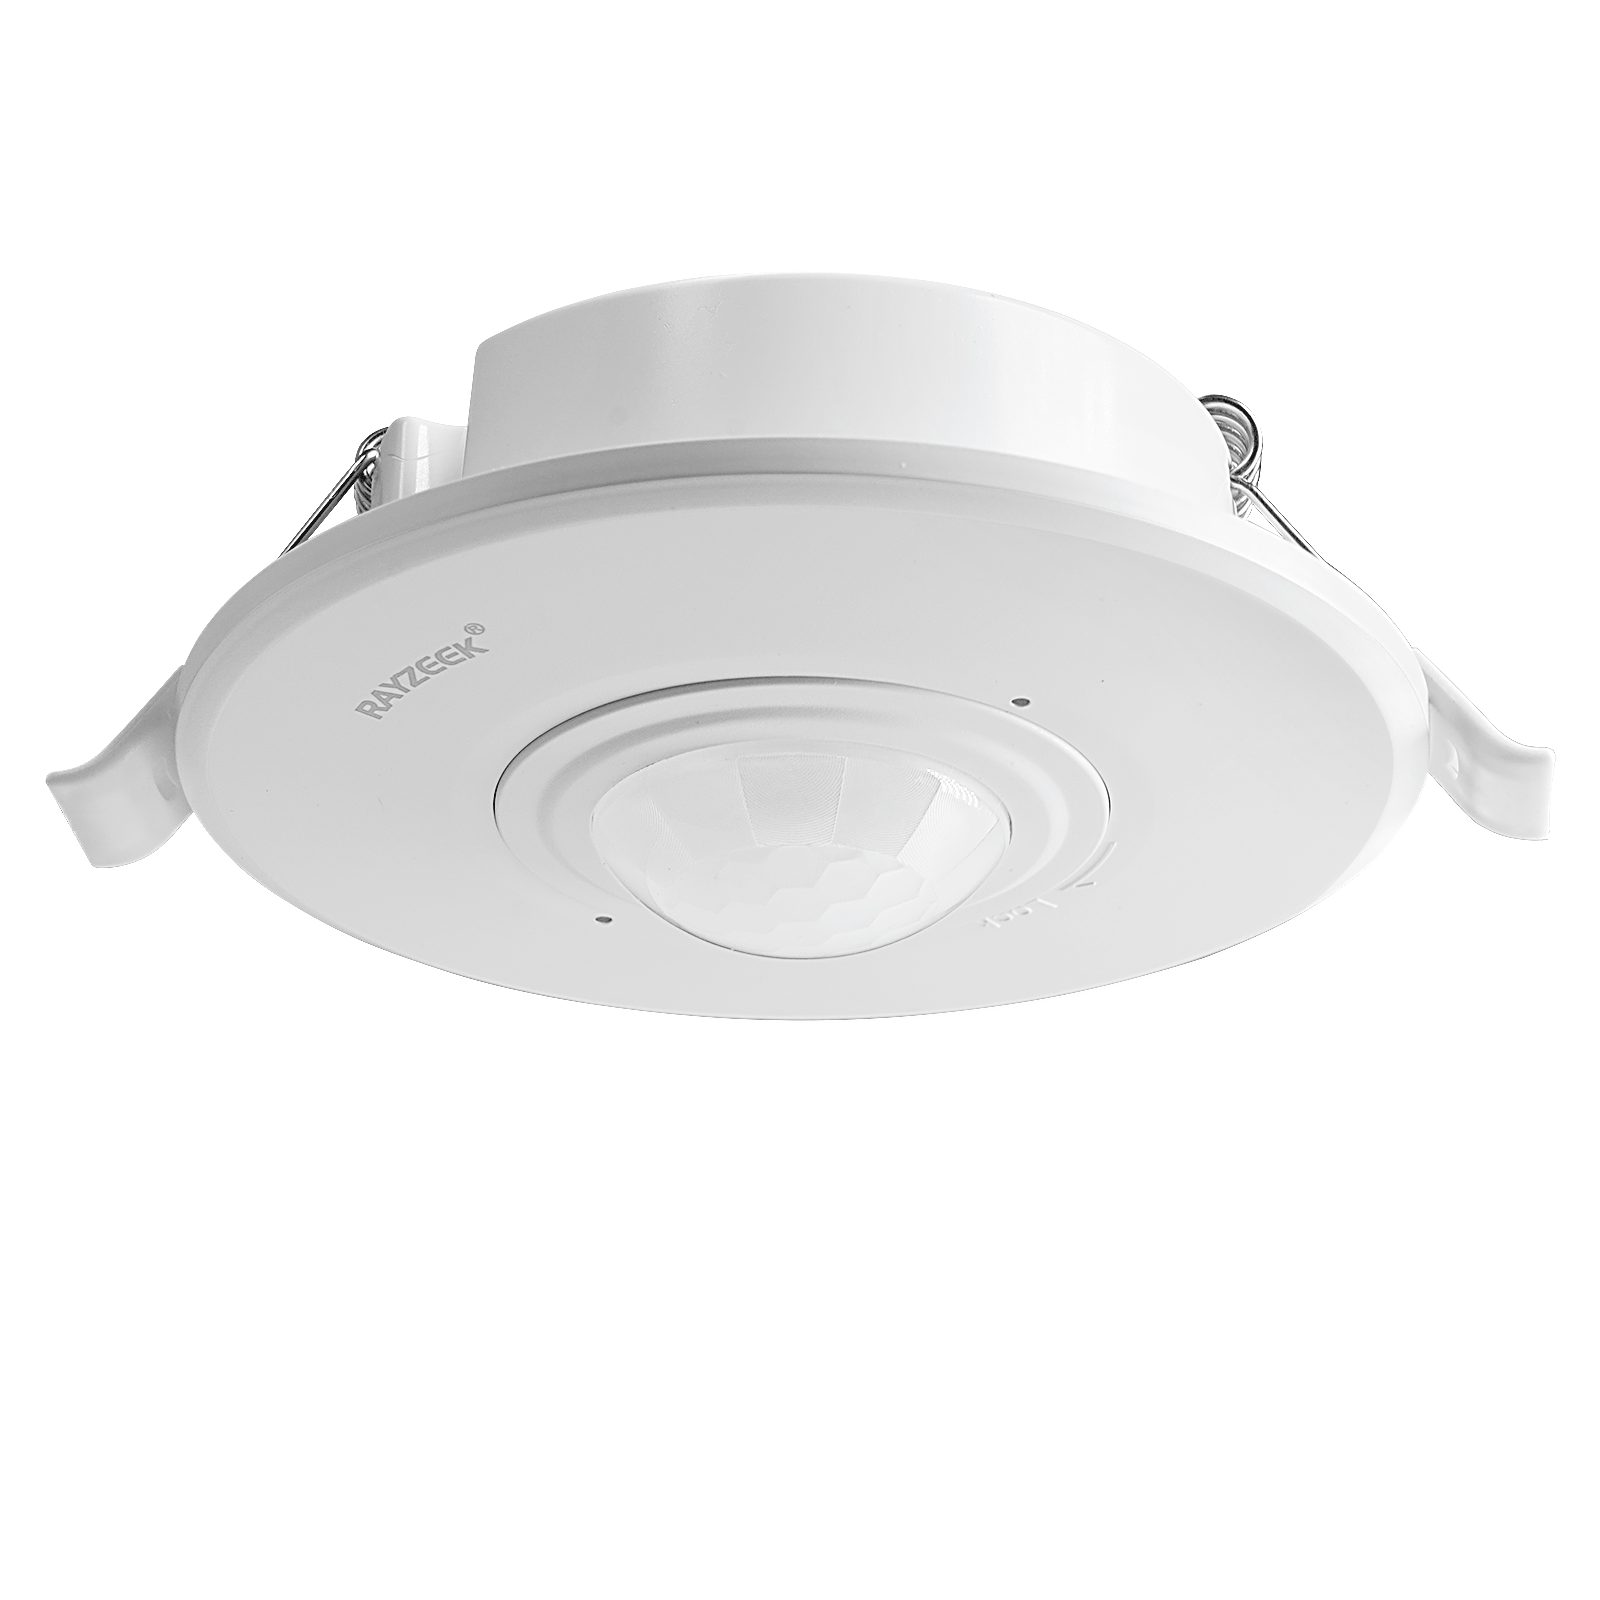
- Sakelar sensor gerak PIR tanam plafon DC tegangan rendah
- Input 12 VDC / 24 VDC dengan rentang 10-30 VDC
- Arus kerja maks 10A dengan jeda waktu, ambang batas Lux, dan sensitivitas yang dapat disesuaikan
- Sakelar sensor gerak PIR tanam plafon beban lebih tinggi
- Input tegangan jala-jala 100-265 VAC, model 10A
- Deteksi 360 derajat dengan jeda waktu, ambang batas Lux, dan sensitivitas yang dapat disesuaikan
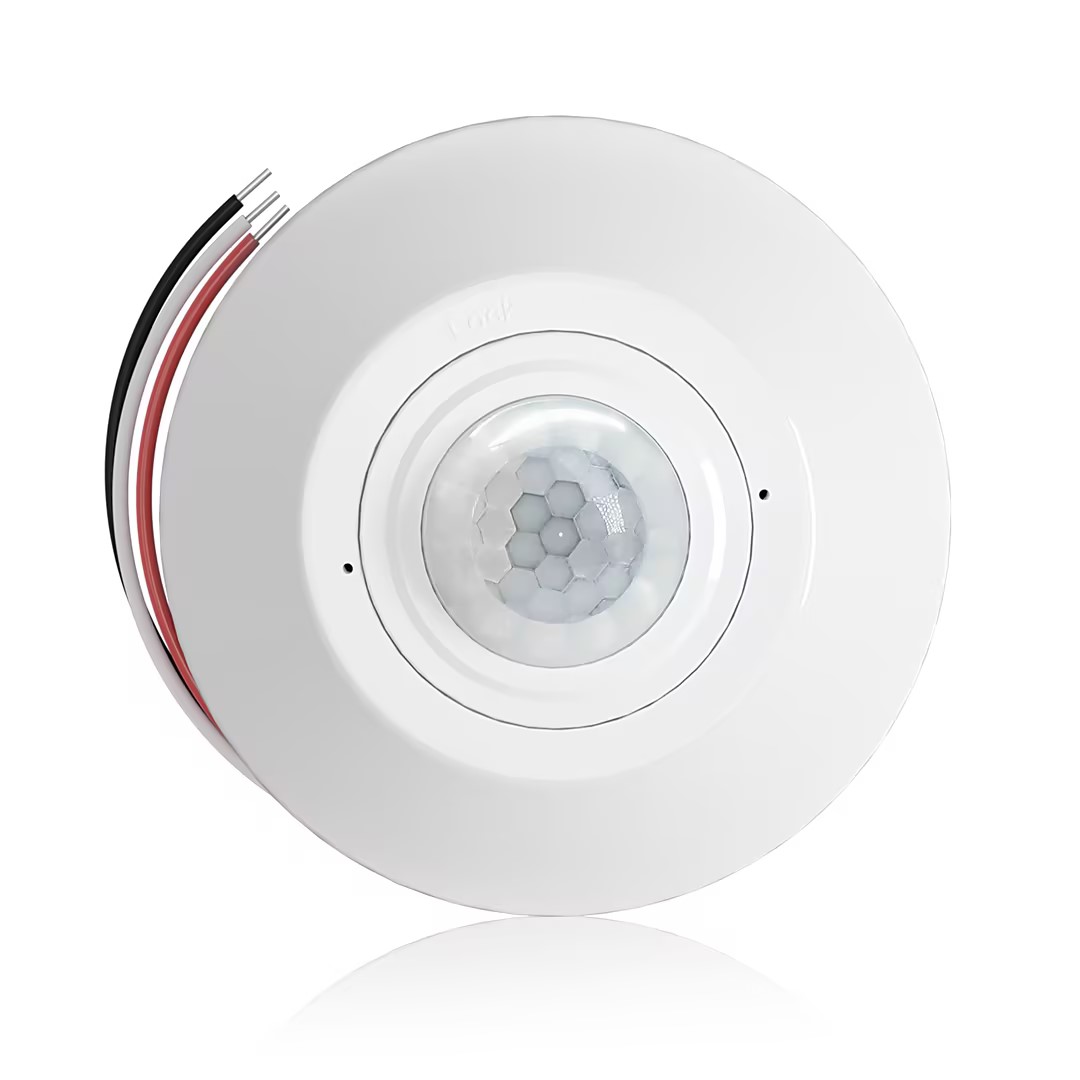
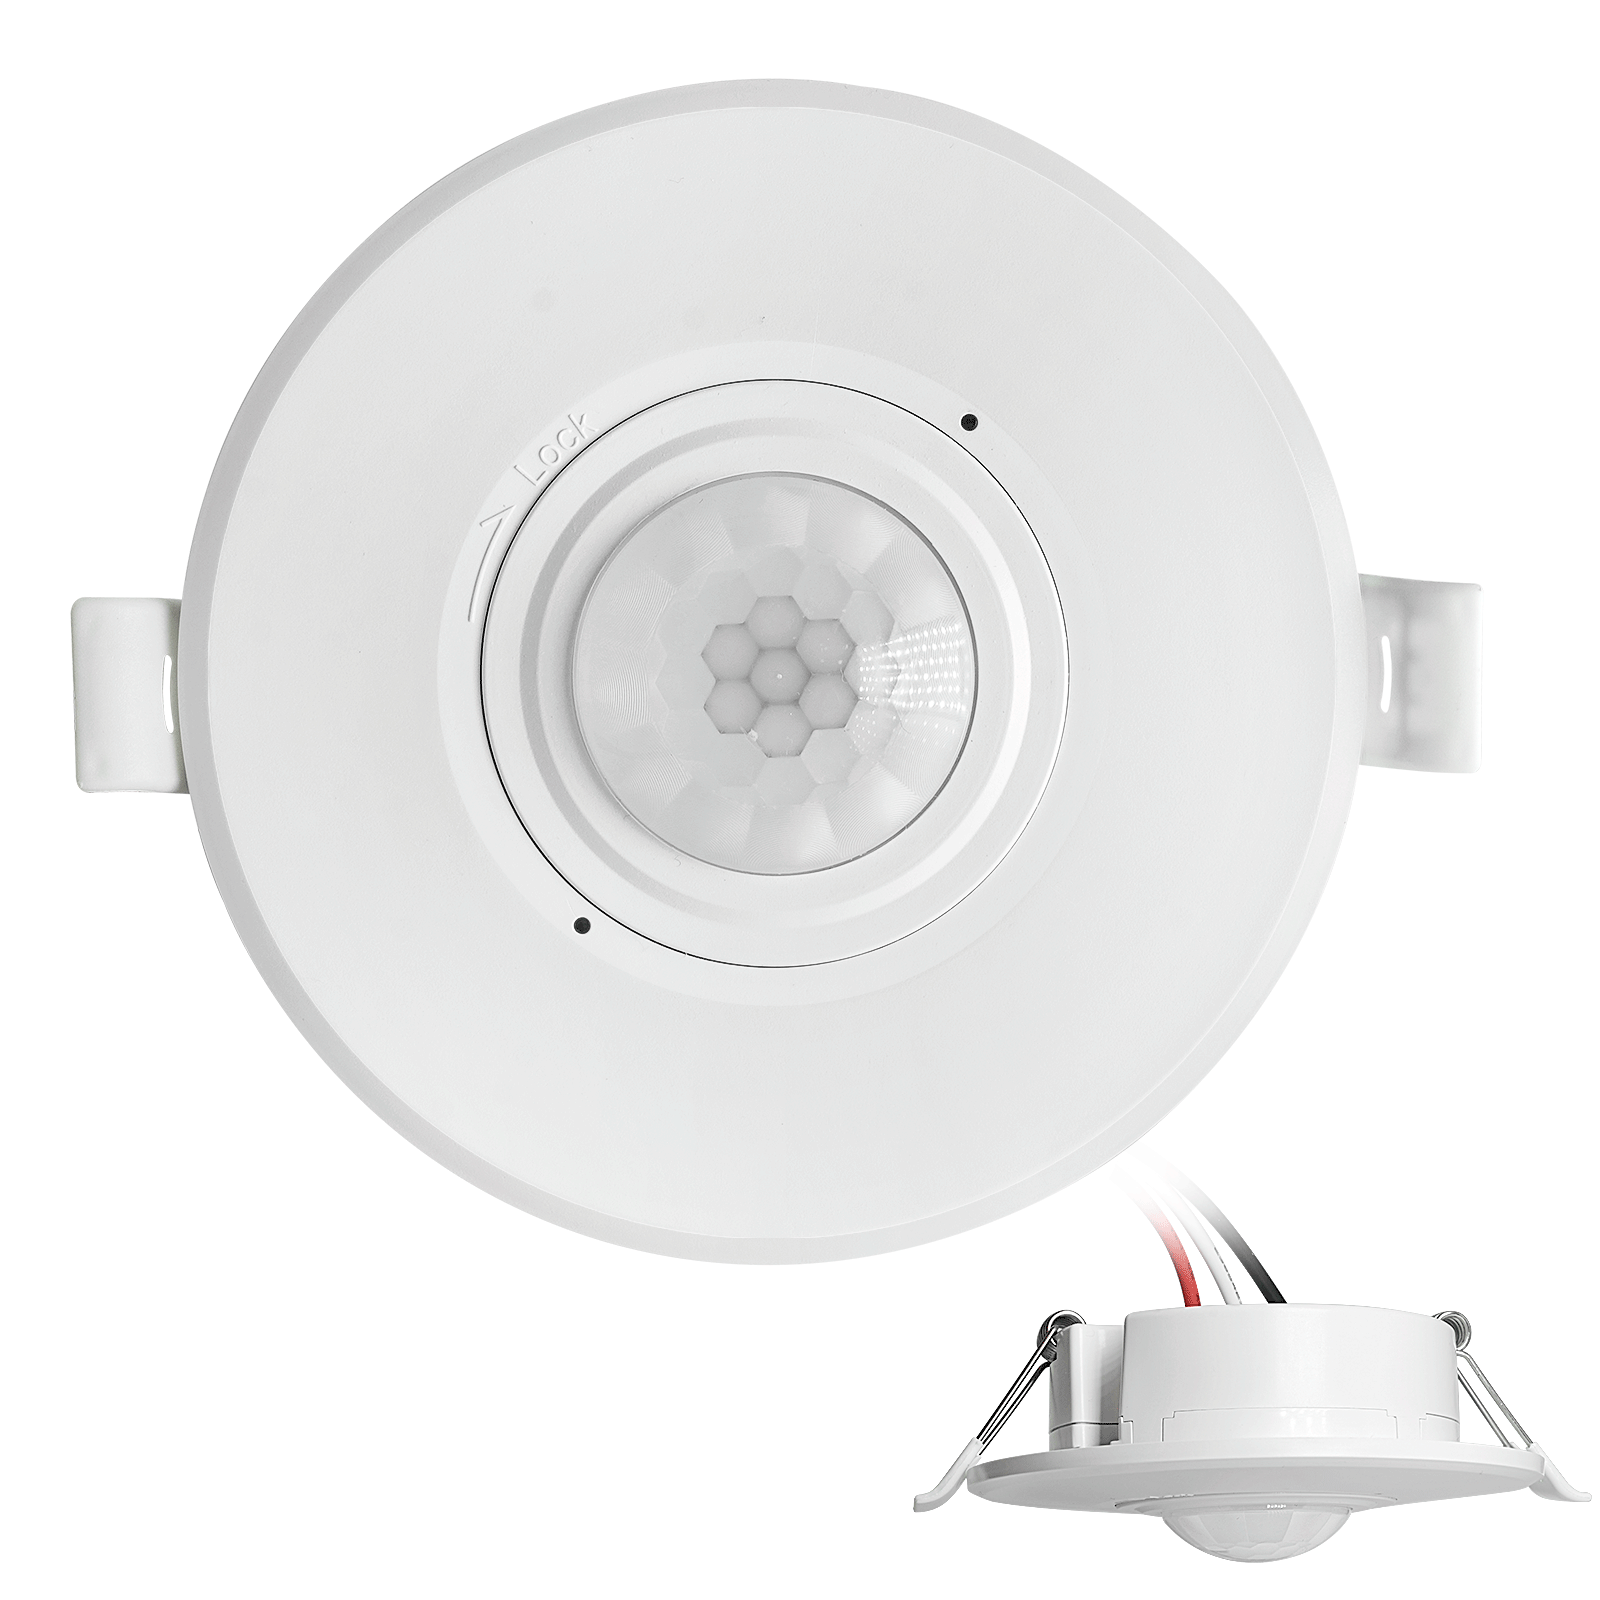
- Sakelar sensor gerak PIR tanam plafon
- Input tegangan jala-jala 100-265 VAC, model 5A
- Deteksi 360 derajat dengan jeda waktu, ambang batas Lux, dan sensitivitas yang dapat disesuaikan
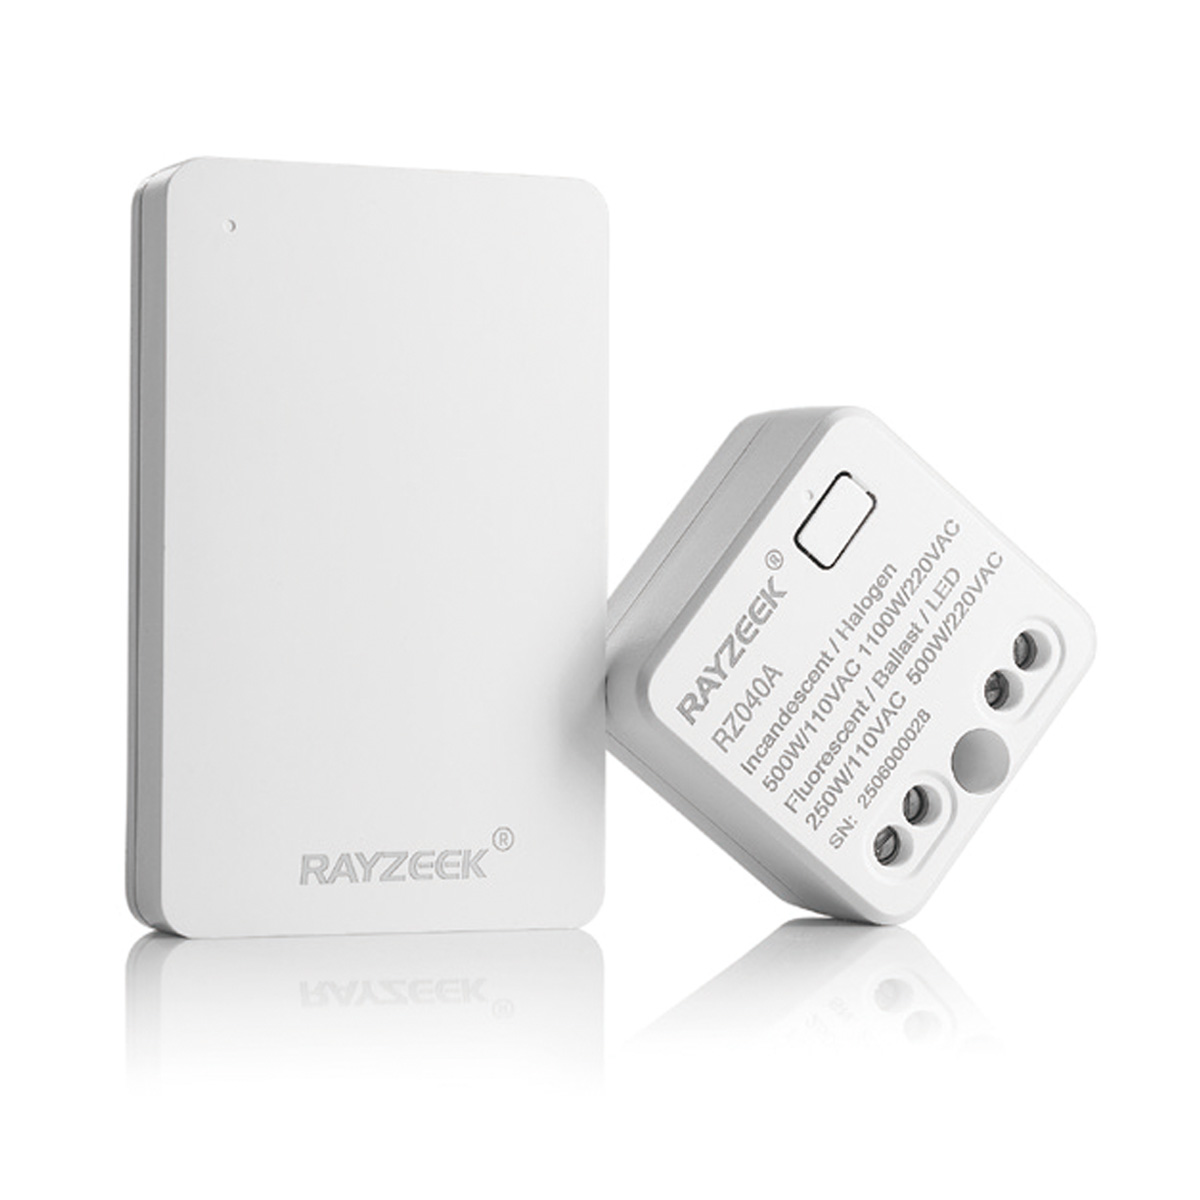
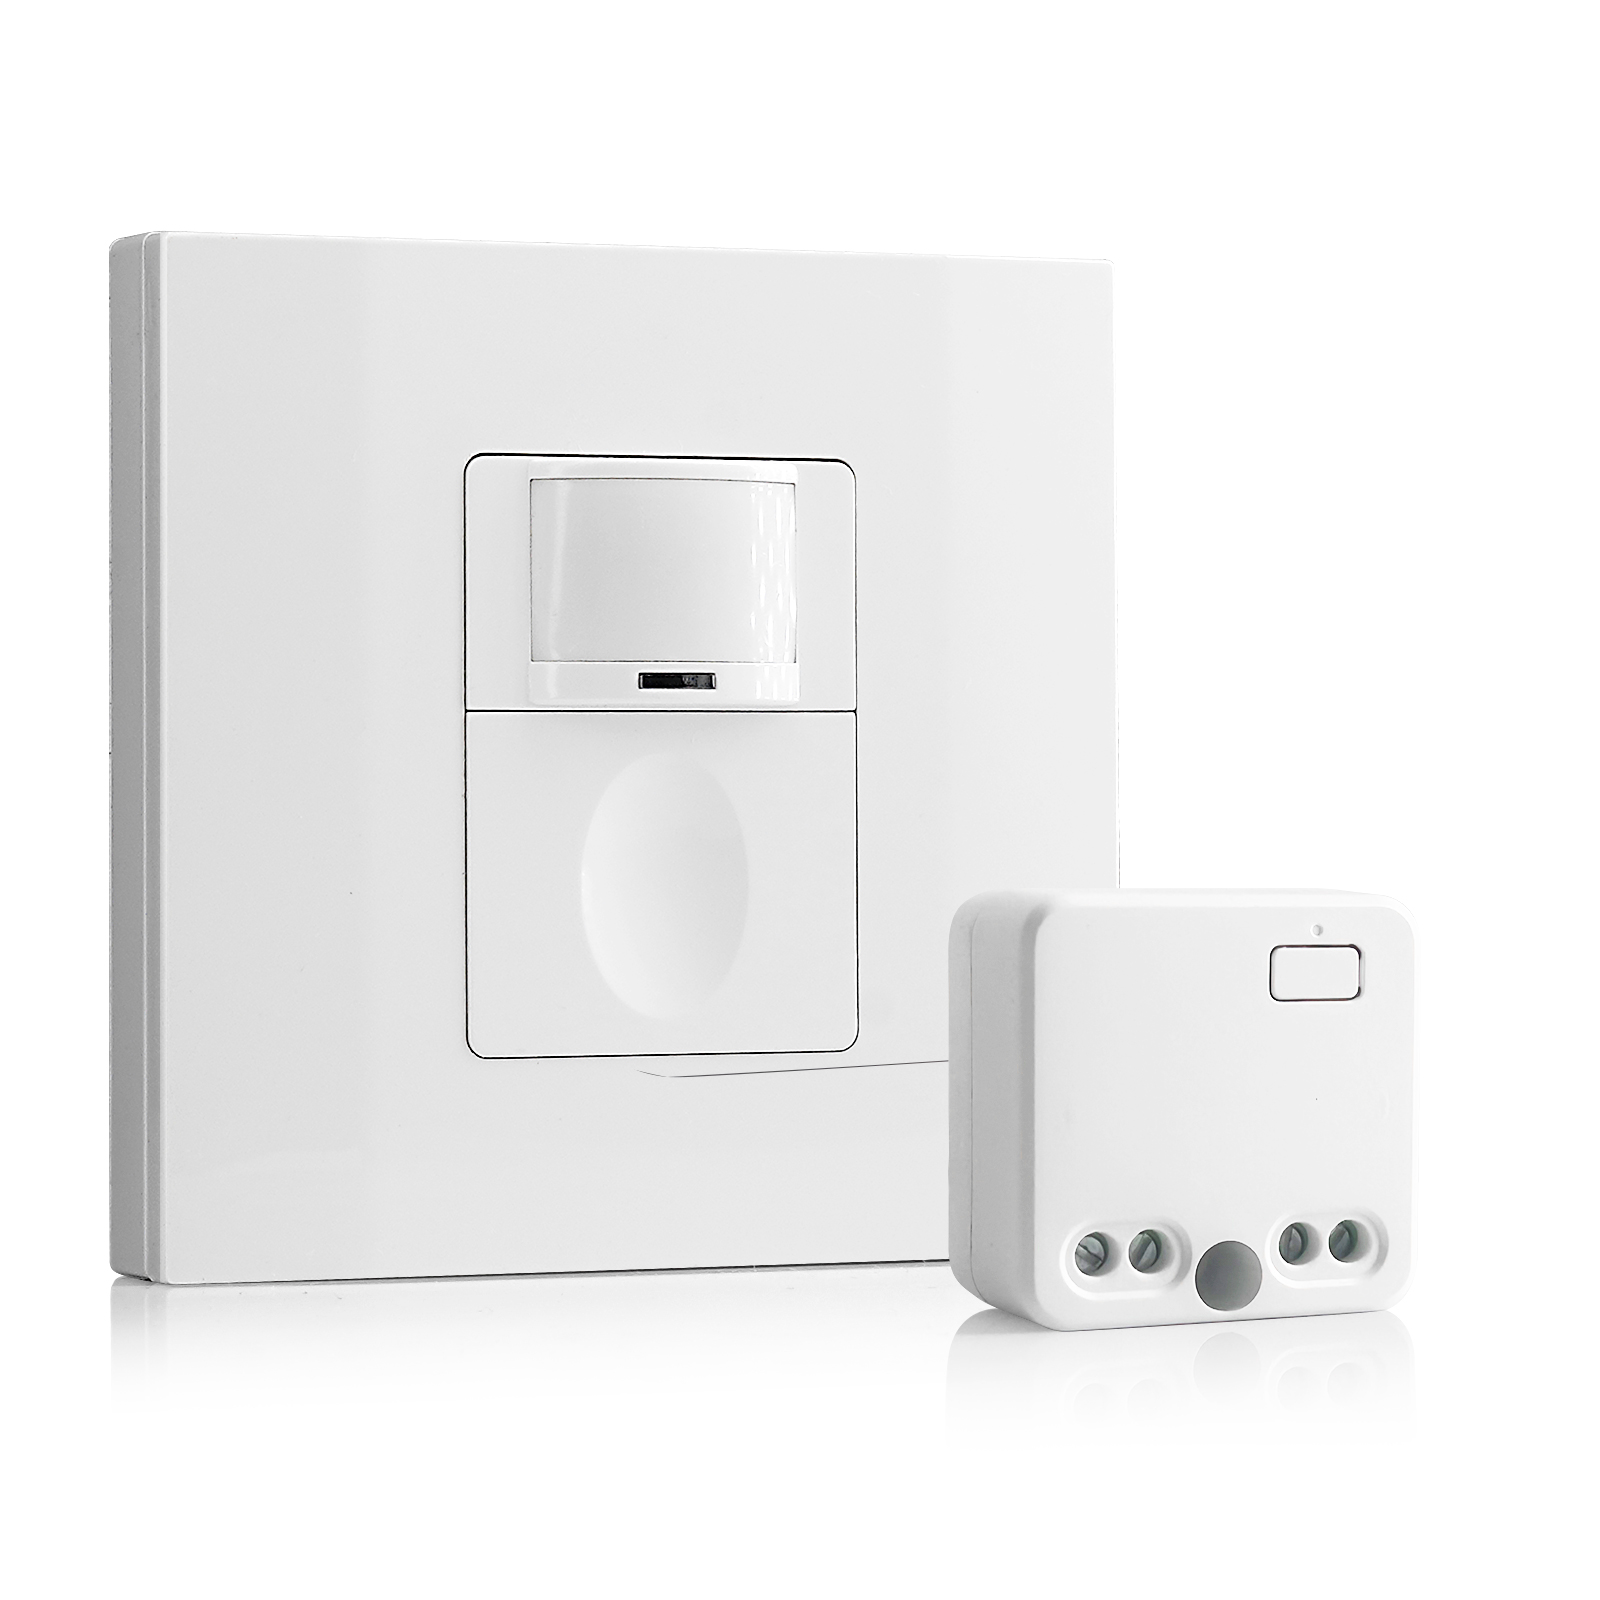
- Kit penerima dan sakelar nirkabel untuk kontrol pencahayaan ON/OFF dalam ruangan
- Penerima 100-230VAC, 50/60Hz dengan arus nominal 5A
- Sakelar nirkabel bertenaga CR2032 dengan komunikasi 2.4GHz
- Okupansi (Auto-ON/Auto-OFF)
- 12–24V DC (10–30VDC), hingga 10A
- Cakupan 360°, diameter 8–12 m
- Jeda waktu 15 dtk–30 mnt
- Sensor cahaya Mati/15/25/35 Lux
- Sensitivitas Tinggi/Rendah
- Mode okupansi Auto-ON/Auto-OFF
- 100–265V AC, 10A (diperlukan kabel netral)
- Cakupan 360°; diameter deteksi 8–12 m
- Jeda waktu 15 dtk–30 mnt; Lux MATI/15/25/35; Sensitivitas Tinggi/Rendah
- Mode okupansi Auto-ON/Auto-OFF
- 100–265V AC, 5A (diperlukan kabel netral)
- Cakupan 360°; diameter deteksi 8–12 m
- Jeda waktu 15 dtk–30 mnt; Lux MATI/15/25/35; Sensitivitas Tinggi/Rendah
- 100V-230VAC
- Jarak Transmisi: hingga 20m
- Sensor gerak nirkabel
- Kontrol berkabel
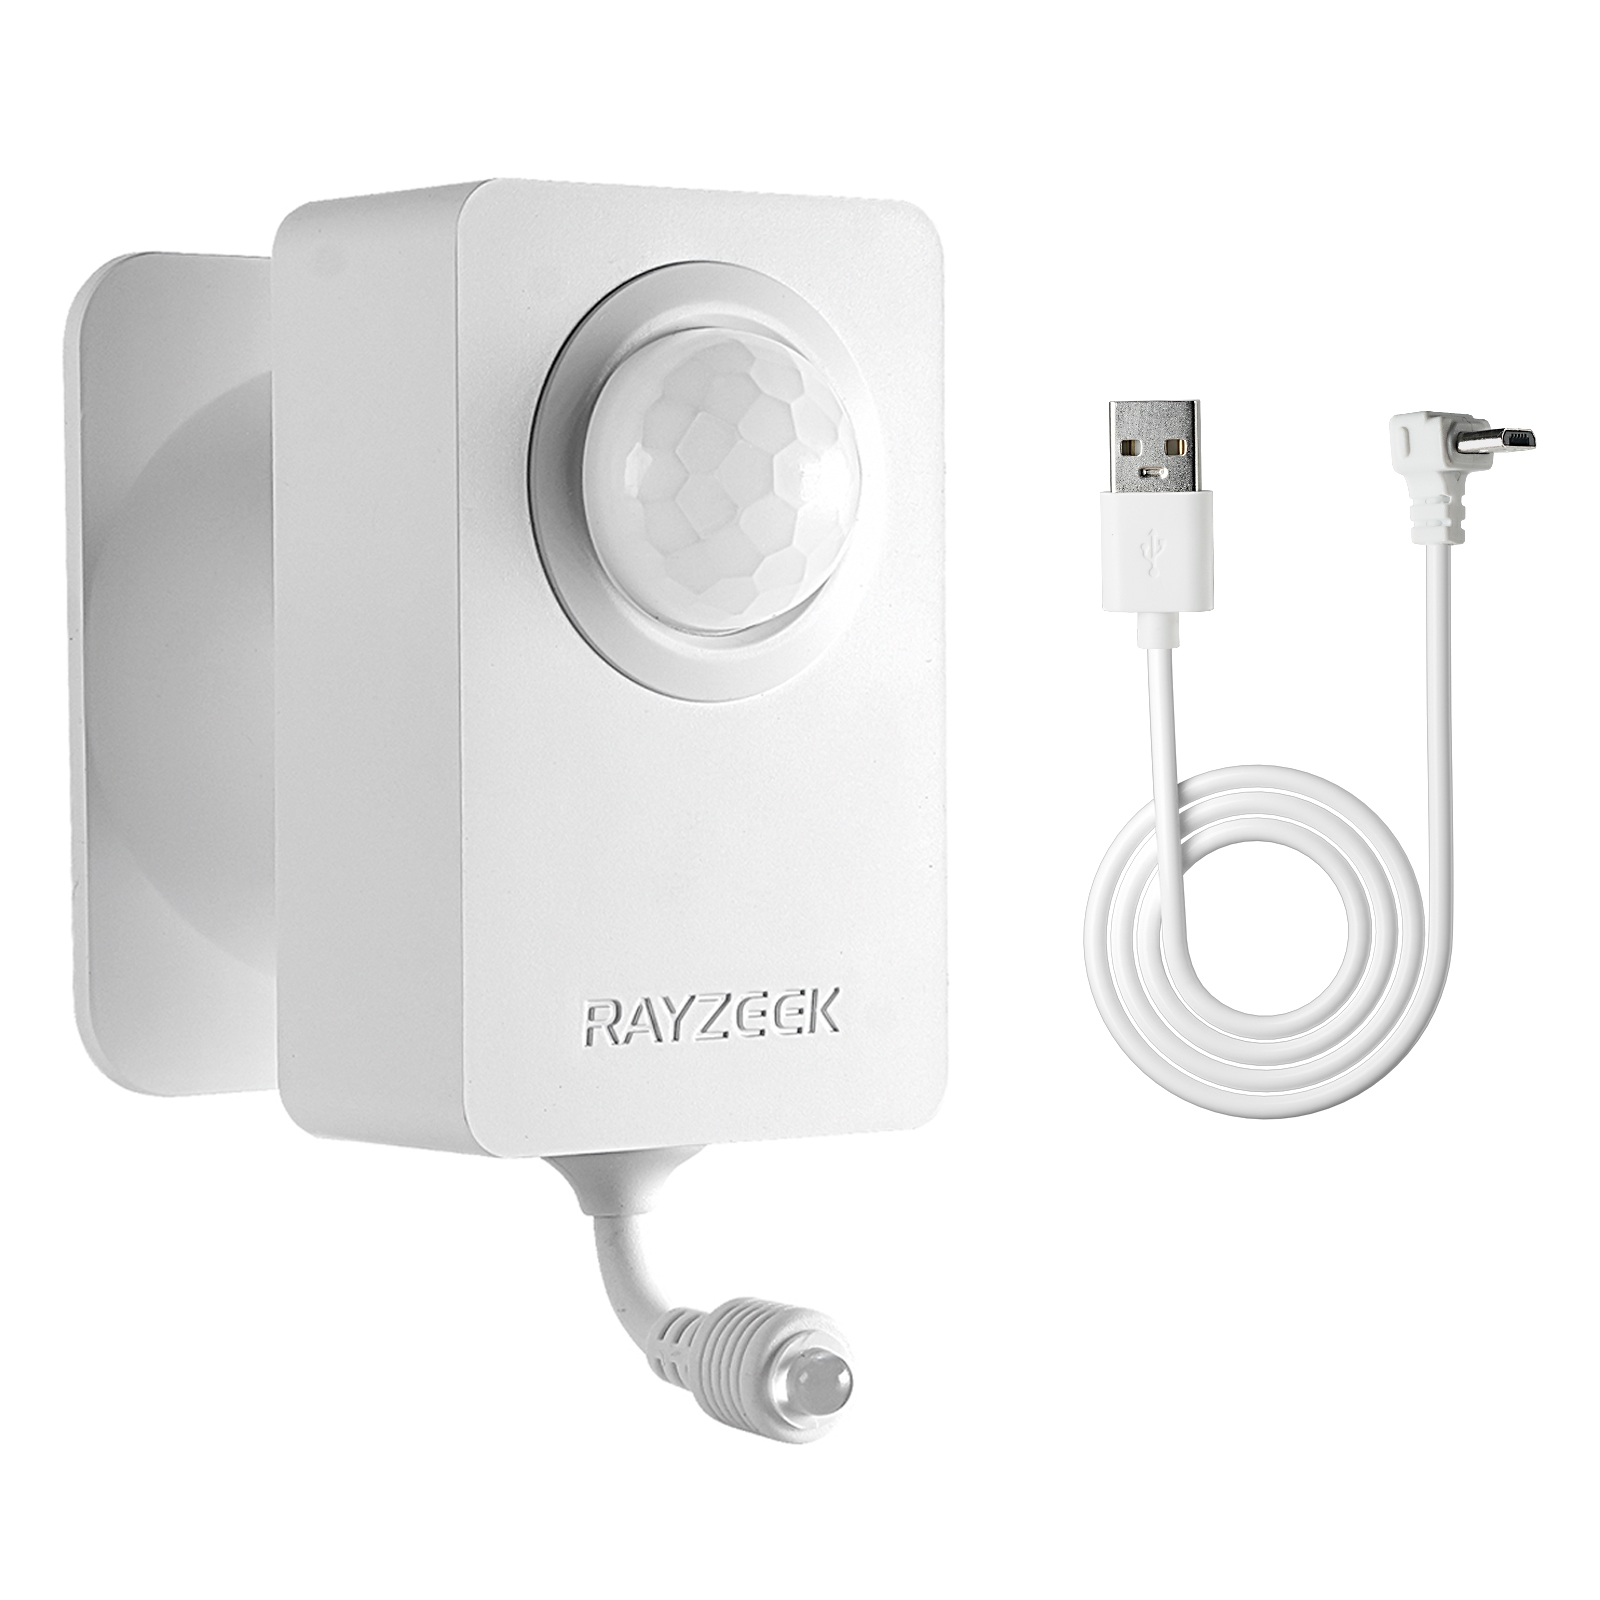
- Tegangan: 2x Baterai AAA / 5V DC (Micro USB)
- Mode Siang/Malam
- Jeda waktu: 15mnt, 30mnt, 1j (bawaan), 2j
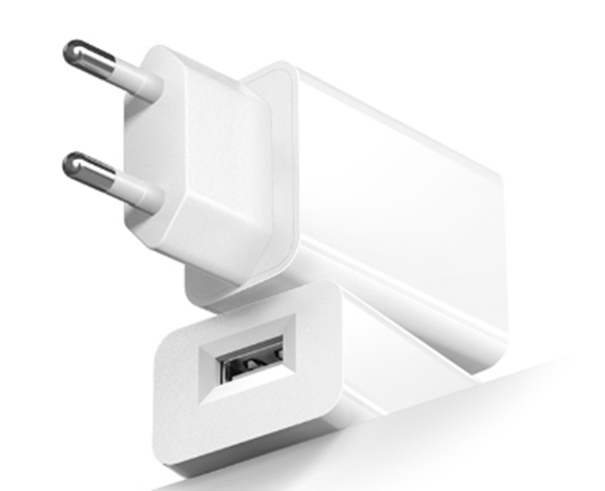
- Adaptor daya colokan UE
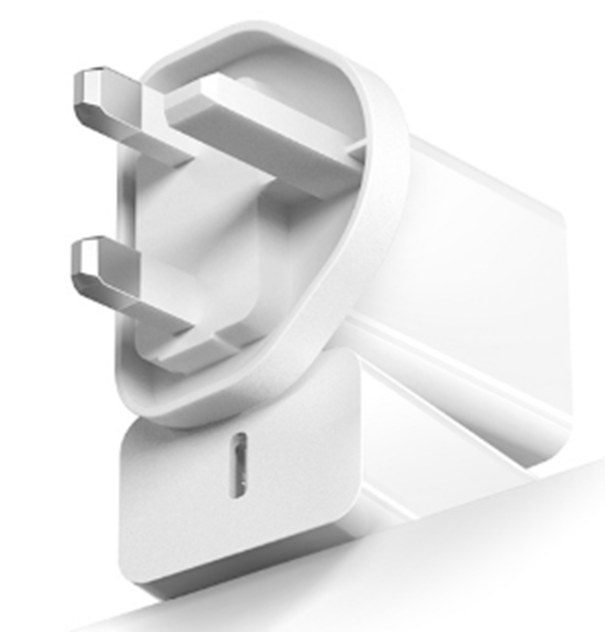
- Adaptor daya colokan Inggris
The SPD curve allows for a precise description of color and serves as a starting point for quantitative analyses of color. It provides data that helps in understanding how different lighting conditions can affect the perception of color. By comparing the SPD curves of different light sources, one can evaluate the accuracy and consistency of the color rendering.
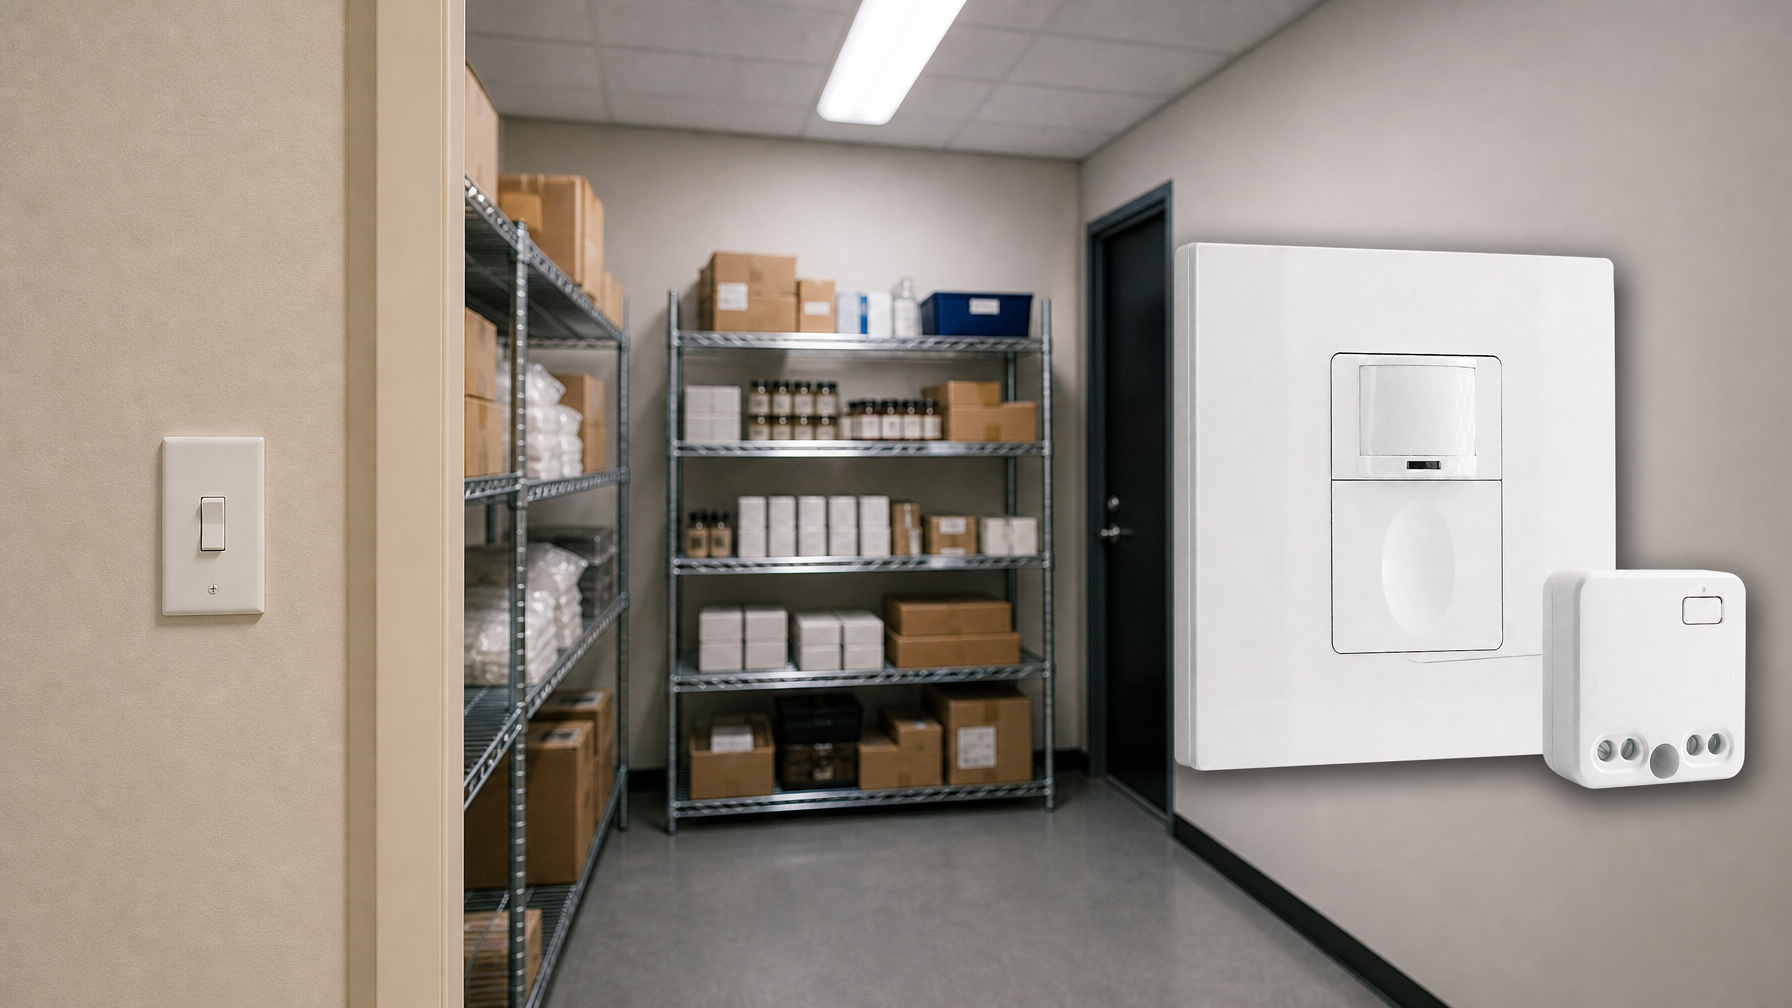
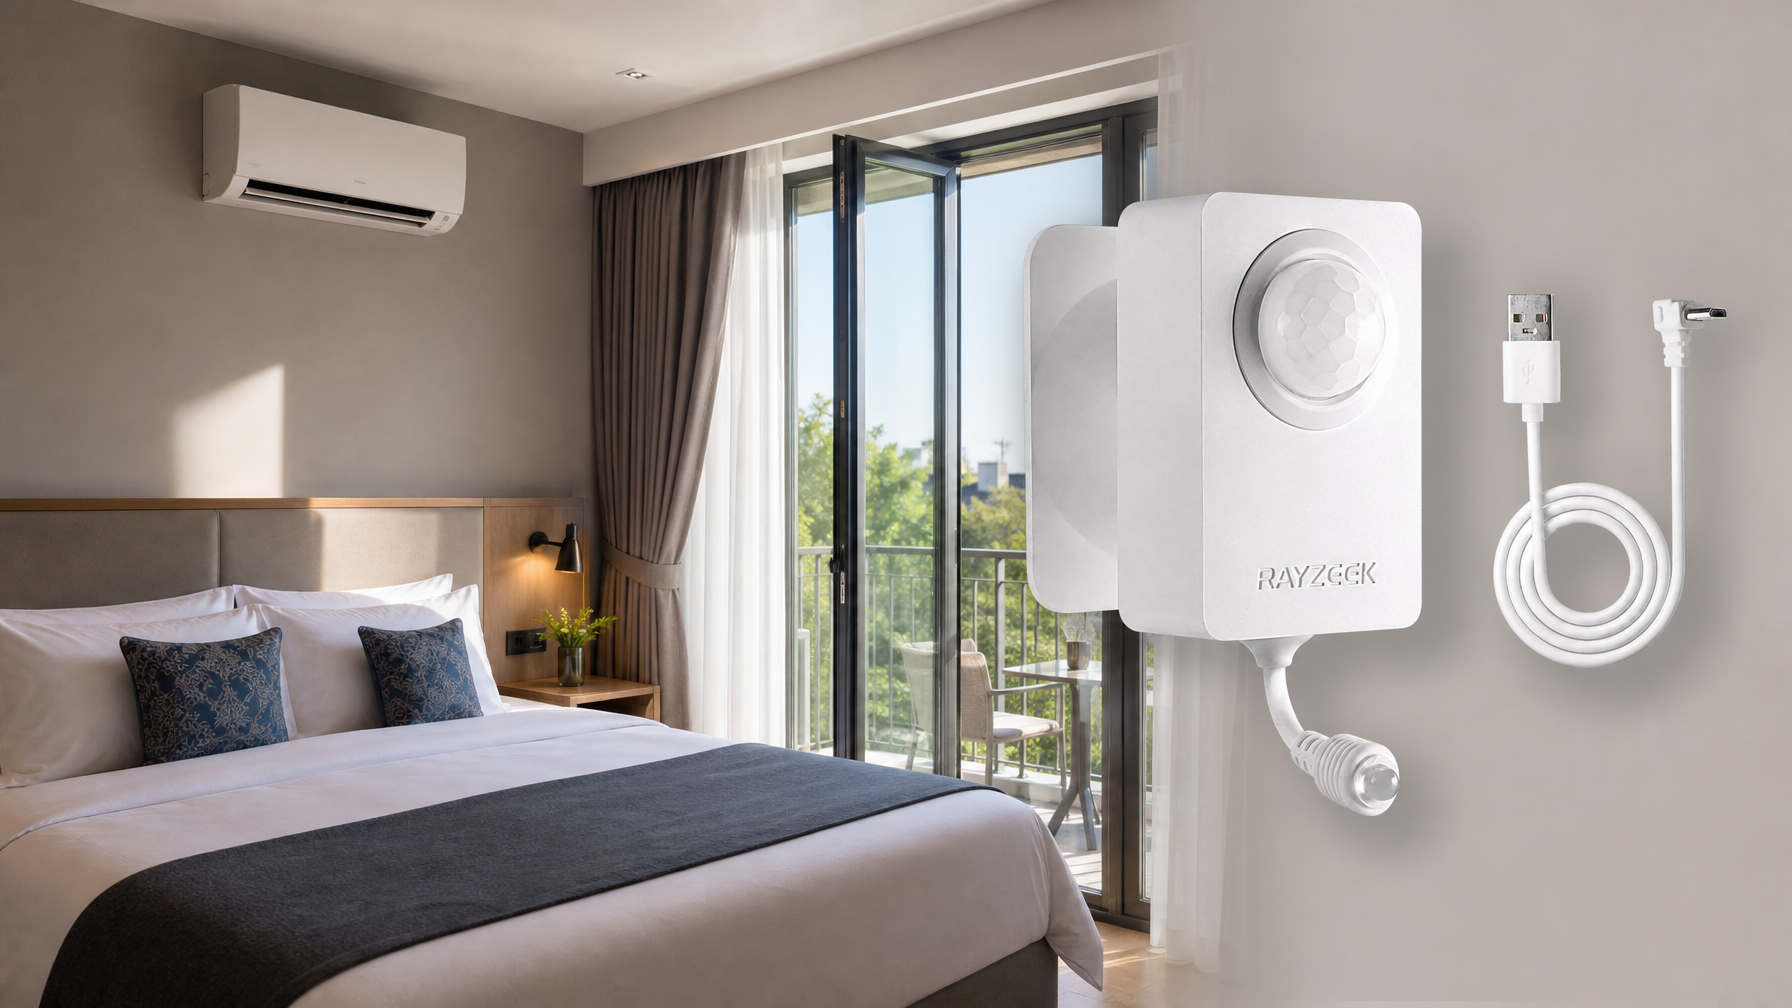
Dapatkan Inspirasi dari Portofolio Sensor Gerakan Rayzeek.
Tidak menemukan apa yang Anda inginkan? Jangan khawatir. Selalu ada cara alternatif untuk menyelesaikan masalah Anda. Mungkin salah satu portofolio kami dapat membantu.
Frequently Asked Questions
What Is SPD in Lighting
SPD, which stands for Spectral Power Distribution, refers to the distribution of power across different wavelengths of light emitted by a light source. The visible white light that we perceive is composed of a range of colors, spanning from violet (380nm) to red (760nm).
How Is Spectral Power Distribution Measured
The measurement of spectral power distribution (SPD) involves the use of a spectrophotometer. By analyzing the SPD, it is possible to derive both the luminance and chromaticity of a color, which allows for an accurate description of the color within the CIE system. Additionally, the SPD can be linked to other color measurement systems.
What Is the Spectral Distribution of LED Lights
The spectral distribution of LED lights is determined by the spectrum of spontaneous emission, which usually follows a Gaussian shape. LED lights in the 1300-1500nm range can have spectral widths ranging from 50 to 180nm. Specifically, the spectral width of an LED with a wavelength of 1300nm is being analyzed.
What Is SPD Curve
SPD curves are obtained by using a Spectroradiometer, which is specifically designed to measure the spectral density of an illuminant. These curves provide information about the relative intensity of a light source at various defined steps across the visible region of the electromagnetic spectrum, typically ranging from 380nm to 780nm.